YouCalc Study · Lifestyle & Everyday · Last reviewed 2026-07-01
The Phantom-Power Index: what always-on devices really cost per year
“Phantom” or standby power is the electricity a device draws while switched off but still plugged in — the set-top box waiting for the remote, the console in instant-on, the PC asleep. Individually the watts look trivial; left on 24/7/365 they run up a real yearly bill. But the number that actually decides that bill is not the device — it is your electricity tariff. The same digital-cable box with a DVR, drawing a reference 43.5 W of standby, costs about €147/yr in Germany, roughly €41/yr in Hungary and about $72/yr in the United States — a ~3.6× spread on identical hardware, driven purely by price per kilowatt-hour. Below, 35 always-on devices are ranked by yearly standby cost at one reference tariff, then four flagship devices are priced across eight markets so you can see the tariff — not the gadget — do the work.
Key findings
Which always-on devices cost the most in standby power? We rank 35 devices by yearly standby cost and price four across countries. 2025 data.
- Highest Set-top box, digital cable w/ DVR — €110/yr
- Lowest Mobile-phone charger — €0.66/yr
- Notable 3/4 devices
- Coverage 35 devices · 2025
How the numbers are computed. For every device, annual kWh = standby watts × 8760 ÷ 1000, and annual cost = annual kWh × tariff. The 8760 hours assume the device stays plugged in and drawing continuously all year. Standby watts are the typical value from the LBNL Standby Power dataset, shown with the metered min–max range. These are historical reference measurements (see the caveats), not a claim about the exact unit under your TV today.
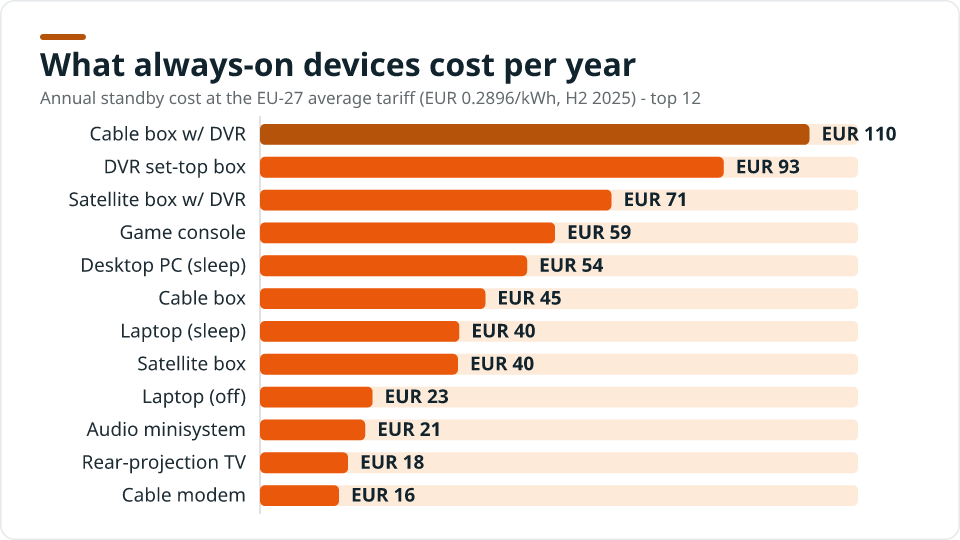
Which always-on devices cost the most per year
Ranked by annual standby cost at the EU-27 average residential tariff, €0.2896/kWh (Eurostat, all taxes included, band DC, H2 2025). Standby watts are the typical LBNL value; the smaller figure is the metered min–max range.
| # | Device (standby mode) | Standby W — typ [min–max] | kWh / yr | Cost / yr (€) |
|---|---|---|---|---|
| 1 | Set-top box, digital cable w/ DVR (off by remote) | 43.46 [43.3–43.61] | 380.7 | €110.25 |
| 2 | Set-top box, DVR (off) | 36.68 [23.3–48.6] | 321.3 | €93.05 |
| 3 | Set-top box, satellite w/ DVR (off by remote) | 27.8 [22–33.6] | 243.5 | €70.53 |
| 4 | Game console (ready / instant-on) | 23.34 [2.12–63.74] | 204.5 | €59.21 |
| 5 | Computer, desktop (sleep) | 21.13 [1.1–83.3] | 185.1 | €53.60 |
| 6 | Set-top box, digital cable (off by remote) | 17.83 [13.24–30.6] | 156.2 | €45.23 |
| 7 | Computer, notebook (sleep) | 15.77 [0.82–54.8] | 138.1 | €40.01 |
| 8 | Set-top box, satellite (off by remote) | 15.66 [6.58–33.05] | 137.2 | €39.73 |
| 9 | Computer, notebook (off) | 8.9 [0.47–50] | 78.0 | €22.58 |
| 10 | Audio minisystem (off) | 8.32 [0.3–24.58] | 72.9 | €21.11 |
| 11 | Television, rear-projection (off by remote) | 6.97 [0.2–48.5] | 61.1 | €17.68 |
| 12 | Modem, cable (always-on) | 6.25 [3.64–8.62] | 54.8 | €15.86 |
| 13 | Modem, DSL (on) | 5.37 [3.38–8.22] | 47.0 | €13.62 |
| 14 | VCR (off) | 4.68 [1.2–9.9] | 41.0 | €11.87 |
| 15 | Garage door opener (ready) | 4.48 [1.8–7.3] | 39.2 | €11.37 |
| 16 | Night light, interior (on) | 4.47 [0–27.97] | 39.2 | €11.34 |
| 17 | Furnace, central (standby controls) | 4.21 [0–9.8] | 36.9 | €10.68 |
| 18 | Speakers, computer (on, no sound) | 4.12 [0.69–9.84] | 36.1 | €10.45 |
| 19 | Cordless phone w/ answering machine (ready) | 4 [2.15–7.4] | 35.0 | €10.15 |
| 20 | Microwave (ready — clock) | 3.08 [1.4–4.9] | 27.0 | €7.81 |
| 21 | Television, CRT (off by remote) | 3.06 [0.3–10.34] | 26.8 | €7.76 |
| 22 | Receiver, audio (off) | 2.92 [0–19.7] | 25.6 | €7.41 |
| 23 | Computer, desktop (off) | 2.84 [0–9.21] | 24.9 | €7.20 |
| 24 | Irrigation timer (ready) | 2.84 [1.5–5.9] | 24.9 | €7.20 |
| 25 | Cordless phone (ready) | 2.81 [1.05–4.89] | 24.6 | €7.13 |
| 26 | Telephone answering device (ready) | 2.25 [1.42–2.83] | 19.7 | €5.71 |
| 27 | Clock radio (on) | 2.01 [0.97–7.6] | 17.6 | €5.10 |
| 28 | Printer, laser (off) | 1.58 [0–4.5] | 13.8 | €4.01 |
| 29 | DVD player (off) | 1.55 [0–10.58] | 13.6 | €3.93 |
| 30 | Computer display, LCD (sleep) | 1.38 [0.37–7.8] | 12.1 | €3.50 |
| 31 | Printer, inkjet (off) | 1.26 [0–4] | 11.0 | €3.20 |
| 32 | Coffee maker (off — clock) | 1.14 [0–2.7] | 10.0 | €2.89 |
| 33 | Computer display, LCD (off) | 1.13 [0.31–3.5] | 9.9 | €2.87 |
| 34 | Surge protector (on) | 0.8 [0–6.92] | 7.0 | €2.03 |
| 35 | Mobile-phone charger (plugged, no phone) | 0.26 [0.02–1] | 2.3 | €0.66 |
35 devices from the LBNL Standby Power dataset. Cost = typical standby W × 8760 ÷ 1000 × €0.2896/kWh (EU-27 avg, Eurostat H2 2025). Historical reference watts — see caveats.
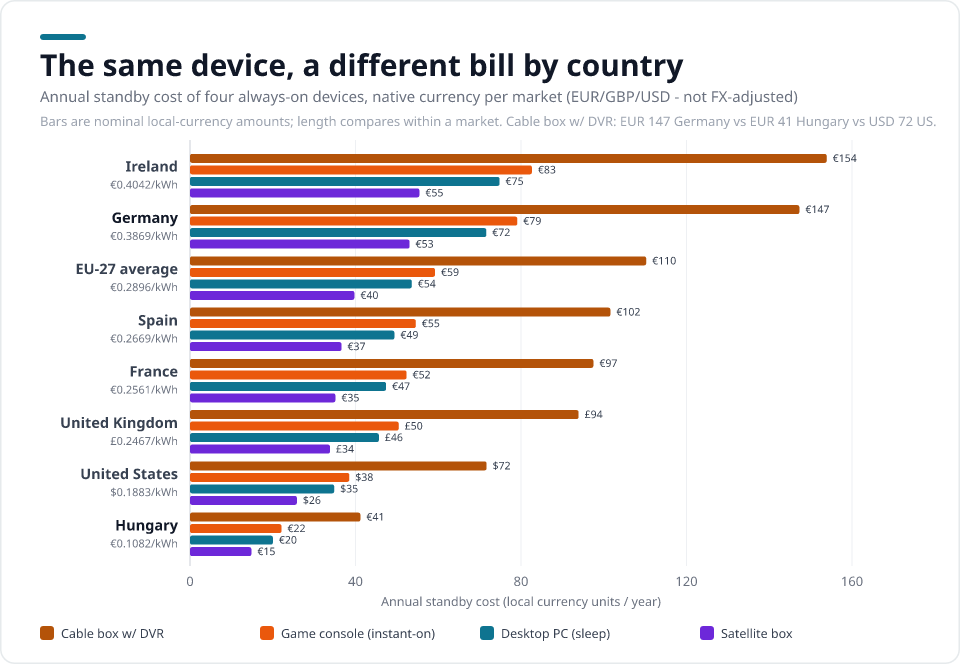
The same device, a different country
Four flagship always-on devices, priced across eight markets. EU rows use the Eurostat all-taxes residential tariff (H2 2025); the UK row uses the Ofgem price cap (Apr–Jun 2026); the US row uses the EIA residential average (Apr 2026). Each cost is in the market’s native currency — they are not FX-converted, and the Eurostat and EIA figures are built differently (see caveats). Look down the “Cable box w/ DVR” column: €147 in Germany against €41 in Hungary and $72 in the US — identical hardware, the tariff doing all the talking.
| Market | Tariff / kWh | Cable box w/ DVR 43.5 W | Game console (instant-on) 23.3 W | Desktop PC (sleep) 21.1 W | Satellite box 15.7 W |
|---|---|---|---|---|---|
| Ireland | €0.4042 | €154 | €83 | €75 | €55 |
| Germany | €0.3869 | €147 | €79 | €72 | €53 |
| EU-27 average | €0.2896 | €110 | €59 | €54 | €40 |
| Spain | €0.2669 | €102 | €55 | €49 | €37 |
| France | €0.2561 | €97 | €52 | €47 | €35 |
| United Kingdom | £0.2467 | £94 | £50 | £46 | £34 |
| United States | $0.1883 | $72 | $38 | $35 | $26 |
| Hungary | €0.1082 | €41 | €22 | €20 | €15 |
Native currency per market (EUR / GBP / USD), not FX-adjusted. Tariff sources: Eurostat nrg_pc_204 (EUR, H2 2025) · Ofgem price cap (GBP, 1 Apr–30 Jun 2026) · EIA EPM Table 5.6.A (USD, Apr 2026). Approx. FX at 2026-07-01: €1 ≈ $1.08 ≈ £0.85.
Add it up: the whole-home phantom load
~67 W
average per home
A peer-reviewed US field study (Ross & Meier, 2002) that metered whole houses found an average continuous standby draw of about 67 watts per home, with standby amounting to roughly 5–10% of a home’s electricity use. At the EU-27 average tariff that 67 W running 24/7 is on the order of €170 a year — before you switch a single device on. It is a background load made of dozens of the small draws in Table 1, which is why it is easy to miss and adds up.
Caveats & method
These are historically-measured standby watts, not today’s spec sheets
The device watts come from the LBNL Standby Power dataset, which is largely 2000s-era metered units. Modern equipment draws far less: since 2010 the EU Ecodesign standby rule (EC 1275/2008) has capped most off-mode/standby draw at 1 W, then 0.5 W, and ENERGY STAR pushed the same way. Read every watt here as “reference measured standby power” illustrating the method and the cross-country tariff swing — not a claim about the exact unit under your TV today.
The “1-watt rule”
In 1999 the IEA proposed a global 1 W standby target; the EU made it binding for most products (1.00 W, tightened to 0.50 W, with networked-standby allowances). A device meeting the modern rule at 0.5 W costs about €1.27/yr at the EU-27 average — two orders of magnitude below the 43.5 W legacy cable box. The gap between the two is the whole point of the reform.
The 8760-hour assumption
Annual figures assume the device is plugged in and drawing standby power continuously, 24 hours a day, 365 days a year (8760 h). That holds well for set-top boxes, modems, security kit and chargers left in the wall, but overstates anything you actually unplug. The companion Electricity Cost Calculator lets you set your own hours per day.
Tariffs are dated and not methodologically identical
Eurostat (EU rows) is a reported all-taxes household price, consumption band DC (2500–4999 kWh), H2 2025. EIA (US row) is revenue ÷ sales — a different construction — residential average, April 2026. Ofgem (UK row) is the GB price-cap unit rate incl. 5% VAT, Apr–Jun 2026, and varies by region. They are kept in native currency and are not merged into one column; any conversion uses a dated FX note (€1 ≈ $1.08 ≈ £0.85 at 2026-07-01).
FAQs
What exactly is “phantom” or standby power?
Electricity a device draws while switched off (or in sleep/ready mode) but still connected to the mains — powering a remote sensor, a clock, a network chip or an instant-on feature. Also called vampire, standby or leaking load.
Why does the same device cost so differently by country?
Because annual cost is watts × hours × tariff, and residential tariffs vary several-fold across markets. The same 43.5 W cable box is about €147/yr in Germany (€0.3869/kWh) but roughly €41/yr in Hungary (€0.1082/kWh) — the hardware is identical.
Are these the watts my current devices draw?
Not necessarily. They are reference values from a historical metering dataset, useful for ranking and method. Post-2010 equipment sold in the EU is capped near 0.5–1 W in standby, so a new device is usually far lower. Use the calculator with your own measured watts for a precise figure.
How much is my whole home’s standby load?
Field studies put the average around 67 W continuous — roughly 5–10% of household electricity. It is the sum of many small always-on draws, which is why a smart power strip that cuts several at once can be worth it.
Sources
- Lawrence Berkeley National Laboratory — Standby Power summary table (per-device measured standby watts, via the Internet Archive)
- Lawrence Berkeley National Laboratory — Standby Power data & metering (methodology)
- Ross & Meier — Whole-House Measurements of Standby Power Consumption (LBNL / OSTI, free full text)
- Eurostat — Electricity prices for household consumers (nrg_pc_204), band DC, all taxes included, H2 2025
- US Energy Information Administration — Electric Power Monthly, Table 5.6.A (Apr 2026)
- Ofgem — Energy price cap, 1 April to 30 June 2026 (GB electricity unit rate)
Cite this study
YouCalc (2025). Phantom-Power Index 2025: what always-on devices really cost per year. https://youcalc.com/en/studies/phantom-standby-power-index/
Free to reuse under CC BY 4.0 — please credit YouCalc with a link.
Related calculators
Electricity Cost Calculator
Electricity cost calculator for any appliance. Enter watts, hours per day, and your rate to see daily, monthly, and yearly running costs. Free.
Ohm's Law & Power Calculator (V, I, R, P)
Solve Ohm's law and DC power: enter any two of voltage, current, resistance or power to get the other two, the full power wheel and an I–V graph.
AI Energy & Water Footprint Calculator
See the energy, water and CO₂ of your AI use. Turn chats, reasoning and image prompts into phone charges, glasses of water and km driven. Free, source-backed.