2026 · Updated 2026-06-30
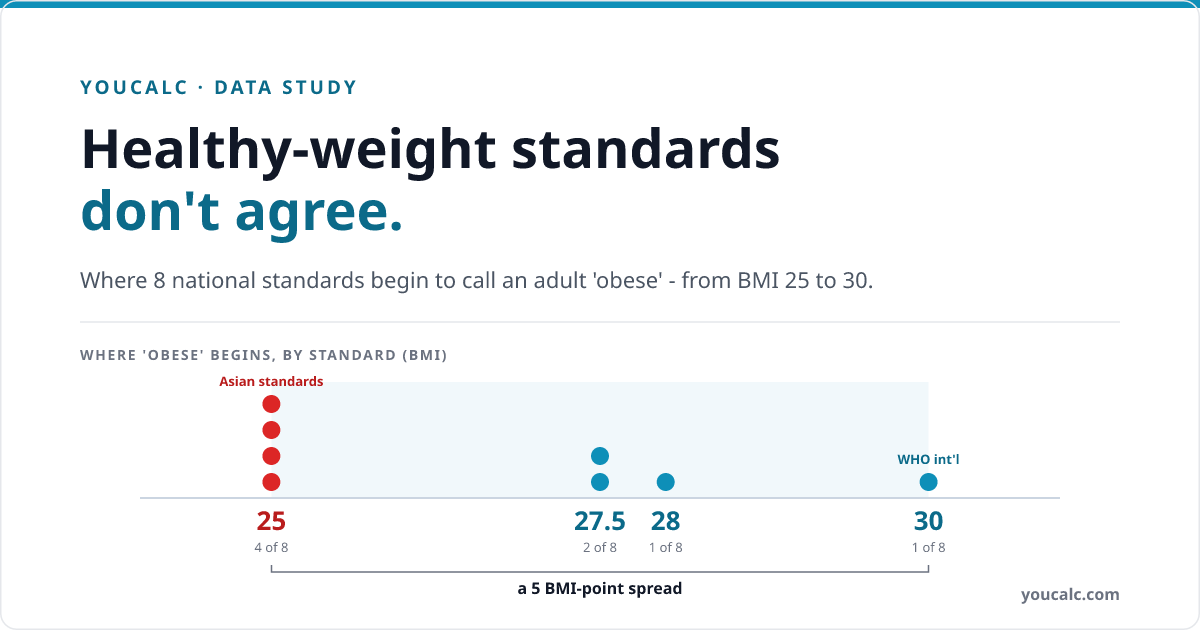
Healthy-Weight Standards Don’t Agree: The Global BMI Cut-off Reference
The line between “healthy” and “overweight” is not a law of nature — it is a committee decision, and the committees disagree. A 170 cm adult who weighs 70 kg (BMI 24.2) is comfortably normal weight under the WHO international standard, already overweight under India’s 2024 ICMR-NIN guideline, and right at China’s overweight line. Push to 73 kg (BMI 25.3) and you are still merely “overweight” to the WHO — but Japan and Korea now classify you as obese. Same body, same scale; different country, different verdict. This reference places the major adult BMI standards side by side, then computes the exact kilogram where each line falls across a height grid.
Key findings
- Range 25–30 BMI
- Lowest WHO/IASO/IOTF — Asia-Pacific, Japan — JASSO, Korea — KSSO, India — Consensus statement — 25
- Coverage 8 standards · 2026
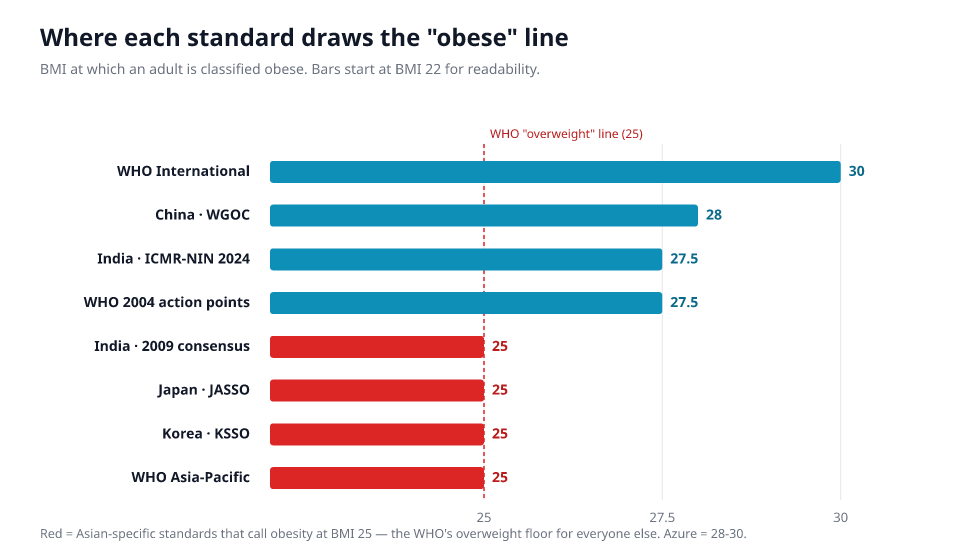
Where each standard draws the “obese” line
How to read this
Each threshold is the published cut-off from its standards body, shown with its edition/year and cited to a non-calculator source. The kilogram table further down is generated by a real function, kg = cutoffBMI × (height/100)², evaluated over a 150–195 cm grid — so the weights are computed at build time, not hand-typed. These are published classification thresholds, not statements of personal medical risk.
The cross-standard cut-off matrix
Every value is the published classification boundary from the named standards body, with its edition and a non-calculator citation. Read across a row to see one standard’s whole scale; read down a column to see how the same boundary moves by jurisdiction. BMI units are kg/m².
| Standard | Normal (healthy) range | Overweight begins | Obese begins | Source / edition |
|---|---|---|---|---|
| WHO — International global cut-off, reaffirmed | 18.5 – 24.9 | ≥ 25 | ≥ 30 | WHO obesity & overweight fact sheet [S1] |
| WHO/IASO/IOTF — Asia-Pacific "Redefining Obesity", 2000 | 18.5 – 22.9 | ≥ 23 | ≥ 25 | Asia-Pacific classification, via KSSO 2022 review [S3] |
| WHO — Expert Consultation Lancet, 2004 (action points) | < 23 | 23.0 * | 27.5 * | WHO Expert Consultation, Lancet 363:157 [S4] |
| China — WGOC Working Group on Obesity, 2002 | 18.5 – 23.9 | ≥ 24 | ≥ 28 | WGOC cut-off study, via KSSO 2022 review [S3][S5] |
| Japan — JASSO obesity-disease guideline, 2024 | 18.5 – 24.9 | — (no band) † | ≥ 25 | JASSO guideline, Endocr J 71(3) [S6] |
| Korea — KSSO Clinical Practice Guidelines, 2022 | 18.5 – 22.9 | ≥ 23 ‡ | ≥ 25 | KSSO 2022 CPG, J Obes Metab Syndr [S3] |
| India — ICMR-NIN Dietary Guidelines, 7 May 2024 | 18.5 – 22.9 | 23 – 27.5 | > 27.5 | ICMR-NIN Dietary Guidelines for Indians 2024 [S2] |
| India — Consensus statement Misra et al., JAPI 2009 | 18.0 – 22.9 | 23 – 24.9 | ≥ 25 | Consensus Statement for Asian Indians, JAPI 57:163 [S7] |
* The 2004 WHO Expert Consultation did not re-define the categories; it flagged additional public-health action points at 23.0, 27.5, 32.5 and 37.5. India’s 2024 ICMR-NIN guideline adopts the 27.5 obese action point, which is why India 2024 (> 27.5) and the older WHO Asia-Pacific 2000 classification (≥ 25) disagree even though both are “Asian” cut-offs. † JASSO uses a single threshold — BMI ≥ 25 is “obese” (himan), with obesity classes 1–4 above it; there is no separate “overweight” band. ‡ KSSO labels 23–24.9 “pre-obese”.
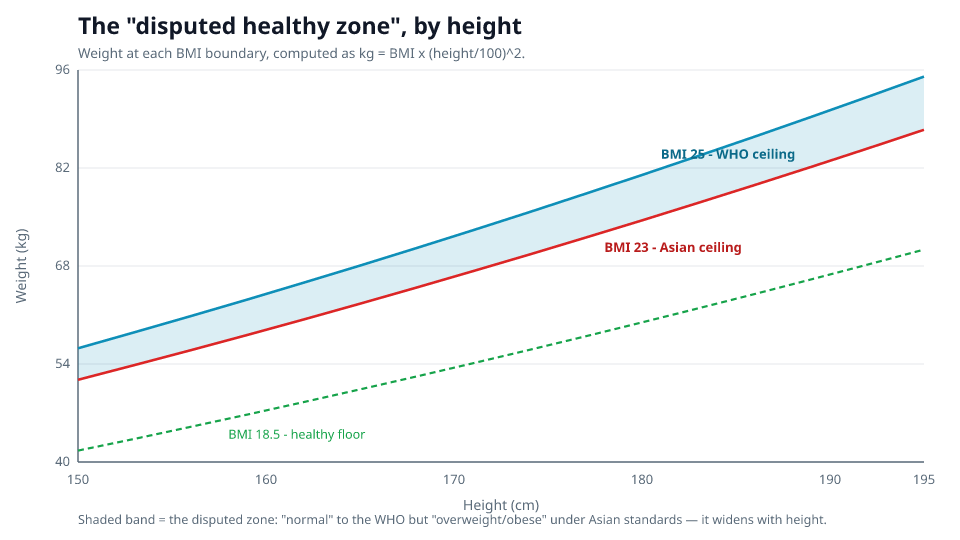
The same height, weighed by every standard (computed)
This table is not typed in. It is generated by the function kg = cutoffBMI × (height/100)², run for every height from 150 to 195 cm. Each cell is the kilogram at which a person of that height crosses the named boundary. The first column is the shared healthy floor (BMI 18.5); the kilogram gap between the BMI-23 and BMI-25 columns is the literal width of the international disagreement. Values are rounded to 0.1 kg.
| Healthy floor | “Overweight begins” — kg at this height | “Obese begins” — kg at this height | ||||||
|---|---|---|---|---|---|---|---|---|
| Height | BMI 18.5 shared floor | BMI 23 Asia-Pac · Korea · India | BMI 24 China WGOC | BMI 25 WHO Intl | BMI 25 Japan · Korea | BMI 27.5 India 2024 | BMI 28 China WGOC | BMI 30 WHO Intl |
| 150 cm | 41.6 | 51.8 | 54.0 | 56.3 | 56.3 | 61.9 | 63.0 | 67.5 |
| 155 cm | 44.4 | 55.3 | 57.7 | 60.1 | 60.1 | 66.1 | 67.3 | 72.1 |
| 160 cm | 47.4 | 58.9 | 61.4 | 64.0 | 64.0 | 70.4 | 71.7 | 76.8 |
| 165 cm | 50.4 | 62.6 | 65.3 | 68.1 | 68.1 | 74.9 | 76.2 | 81.7 |
| 170 cm | 53.5 | 66.5 | 69.4 | 72.3 | 72.3 | 79.5 | 80.9 | 86.7 |
| 175 cm | 56.7 | 70.4 | 73.5 | 76.6 | 76.6 | 84.2 | 85.8 | 91.9 |
| 180 cm | 59.9 | 74.5 | 77.8 | 81.0 | 81.0 | 89.1 | 90.7 | 97.2 |
| 185 cm | 63.3 | 78.7 | 82.1 | 85.6 | 85.6 | 94.1 | 95.8 | 102.7 |
| 190 cm | 66.8 | 83.0 | 86.6 | 90.3 | 90.3 | 99.3 | 101.1 | 108.3 |
| 195 cm | 70.3 | 87.5 | 91.3 | 95.1 | 95.1 | 104.6 | 106.5 | 114.1 |
Worked example at 170 cm: a 70 kg adult is below the WHO overweight line (72.3 kg) but above the Asian one (66.5 kg) — “normal” in Geneva’s table, “overweight” in Delhi’s. At 73 kg they pass the Japan/Korea obese line (72.3 kg) while remaining “overweight” to the WHO until 86.7 kg.
The “disputed healthy zone”, by height
What this reference is — and is not
These are published classification thresholds, not statements of personal medical risk. A standard “calling” you overweight is a population screening boundary, not a diagnosis. BMI is a ratio of mass to height squared: it does not distinguish muscle from fat, ignores fat distribution, and reads differently across age, sex, ethnicity and pregnancy. The very existence of the lower Asian cut-offs reflects evidence that some populations carry higher metabolic risk at a given BMI — which is also precisely why a single global number was never going to fit everyone. Use this table to understand why two reputable sources can disagree about the same body; use a clinician, not a cut-off, for any decision about your health.
How the standards differ
The WHO’s international 25/30 split was derived chiefly from European and North American mortality data. From 2000 onward, Asian bodies argued that their populations develop type-2 diabetes and cardiovascular disease at lower BMIs, and published lower cut-offs: China’s WGOC settled on 24/28, Japan’s JASSO and Korea’s KSSO on a single obese line at 25, and the WHO’s own 2004 expert consultation flagged 23 and 27.5 as action points without formally rewriting the categories. India then split: the 2009 consensus used 23/25, while the 2024 ICMR-NIN guideline moved the obese line up to 27.5 in line with the WHO action point — so the two most recent “Asian Indian” standards do not even agree with each other. Getting the edition and year right is the whole point: the numbers are real, dated and genuinely in conflict.
Sources
- Primary World Health Organization — Obesity and overweight (fact sheet) International adult cut-offs: overweight BMI ≥ 25, obese BMI ≥ 30.
- Primary ICMR-NIN — Dietary Guidelines for Indians (7 May 2024) Asian cut-offs: normal up to 23, overweight 23–27.5, obese > 27.5. The PDF may rate-limit automated fetches.
- Primary Korean Society for the Study of Obesity — 2022 Clinical Practice Guidelines (J Obes Metab Syndr; PMC10327686) Korea: overweight/pre-obese ≥ 23, obese ≥ 25. Also tabulates the WHO Asia-Pacific, China WGOC and Japan JASSO thresholds.
- Reference WHO Expert Consultation — Appropriate body-mass index for Asian populations (Lancet 2004; 363:157–163) Public-health action points at 23.0, 27.5, 32.5 and 37.5 without redefining the WHO categories. Full text is paywalled.
- Reference Working Group on Obesity in China (WGOC) — optimal BMI cut-offs for Chinese adults (Br J Nutr) WGOC: optimal 18.5–23.9, overweight ≥ 24, obese ≥ 28. Corroborates the China row.
- Primary JASSO — Definition and criteria of the guidelines for the management of obesity disease in Japan (Endocr J 2024; 71(3)) Japan: obesity (himan) is BMI ≥ 25 (single threshold); no separate overweight band.
- Reference Misra et al. — Consensus Statement for diagnosis of obesity for Asian Indians (2009; via PMC) India 2009: normal 18.0–22.9, overweight 23–24.9, obese ≥ 25. Shown alongside the 2024 figures to make the edition difference explicit.
“Primary” = the standards body’s own publication or its official guideline; “Reference” = a peer-reviewed paper or authoritative review corroborating a value whose primary document is paywalled or rate-limited. No calculator is cited as a source. Every BMI figure in the tables traces to one of these sources.
Cite this study
YouCalc (2026). Global BMI Cut-off Reference 2026. https://youcalc.com/en/studies/global-bmi-cutoff-reference/
Free to reuse under CC BY 4.0 — please credit YouCalc with a link.
Related calculators
BMI Calculator
Calculate your Body Mass Index and see where you land on the WHO healthy-weight range. Metric or imperial, instant, free, no sign-up.
Ideal Weight Calculator
Find your ideal body weight from four classic formulas plus the healthy BMI range for your height. Metric or imperial, instant, free, no sign-up.
Body Fat Calculator
Estimate your body-fat percentage with the U.S. Navy circumference method and see your fitness category. Metric or imperial, instant, free, no sign-up.
BMR Calculator
Calculate your basal metabolic rate using the Mifflin-St Jeor equation and preview daily calorie needs by activity level. Metric or imperial, free.