YouCalc Study · Finance & Money · Last reviewed
Deposit Insurance Coverage Index: what a bank guarantee is really worth
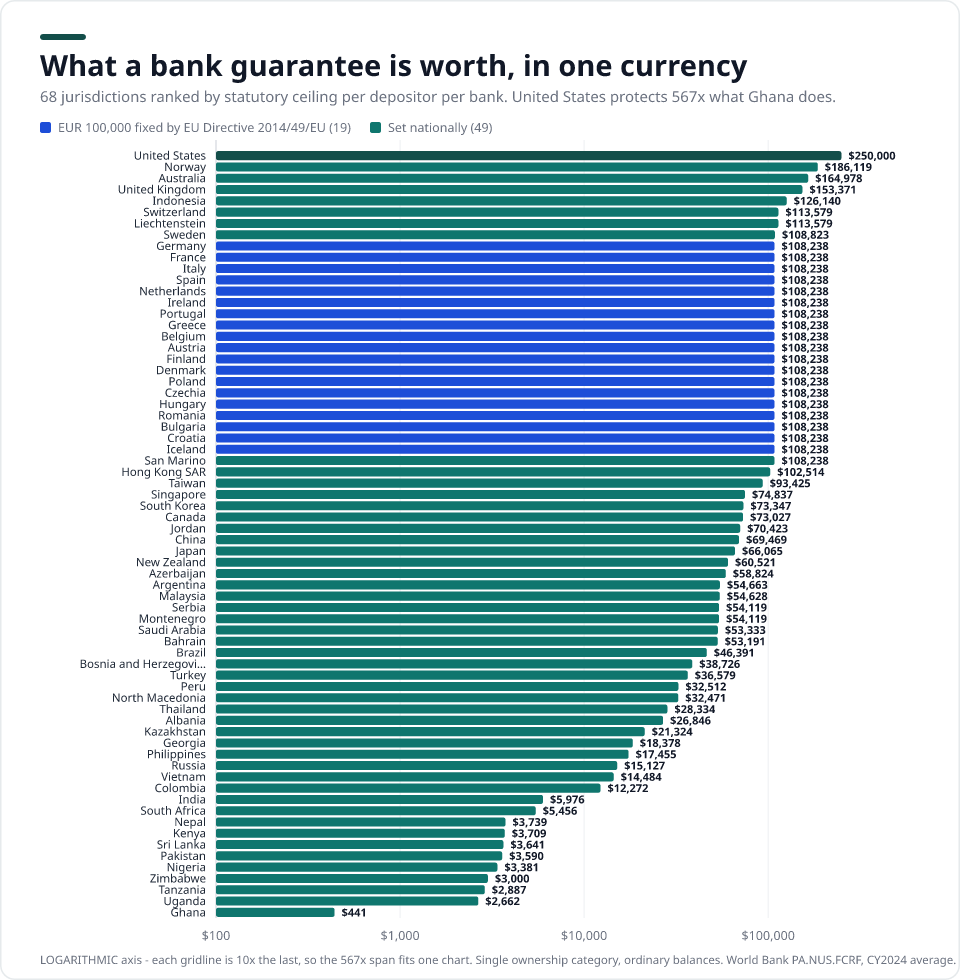
If your bank fails, the law guarantees your deposits only up to a ceiling. Across 68 jurisdictions that ceiling runs from about $441 (Ghana) to $250,000 (United States) — a 567× gap. But the sharper finding is what happens when the ceiling is identical: 19 of these jurisdictions are fixed at exactly €100,000, not because 19 governments independently chose the same number but because Article 6(1) of EU Directive 2014/49 fixes it. Measured against income per person, that one legal constant protects 6.42× more years in Bulgaria than in Ireland. The variation everyone reports is in the currency. The variation that matters is in the denominator.
Key findings
The same €100,000 deposit guarantee covers 6.2 years of income in Bulgaria but only 0.96 in Ireland. We compare the legal limits in 68 jurisdictions.
- Highest United States — $250,000
- Lowest Ghana — $441
- Notable 19 countries × €100,000 → 6.4×
- Coverage 67 countries · 2024
How the numbers are computed. Each statutory ceiling is converted to US dollars at the World Bank official exchange rate (LCU per US$, period average) for 2024, then divided by GDP per capita for the same year to give the years of average income it protects. Ceilings set in euro by law convert once from the euro rate and are never back-converted from a national currency. The ceilings themselves are current as of 2026-07; only the conversion spine is 2024, because that is the latest complete calendar year published.
One law, one number, 6.42× the value
These 19 jurisdictions all guarantee exactly €100,000 per depositor per bank. That is not a national policy choice — Directive 2014/49/EU Article 6(1) sets it, and every EU and EEA member transposes the same figure. In dollars they are therefore indistinguishable, all at $108,238. Set against income per person, they are not remotely alike.
| Jurisdiction | Ceiling (USD) | GDP per capita | Years protected |
|---|---|---|---|
| Bulgaria | $108,238 | $17,597 | 6.15× |
| Romania | $108,238 | $20,080 | 5.39× |
| Hungary | $108,238 | $23,305 | 4.64× |
| Croatia | $108,238 | $24,050 | 4.50× |
| Greece | $108,238 | $24,626 | 4.40× |
| Poland | $108,238 | $25,104 | 4.31× |
| Portugal | $108,238 | $29,328 | 3.69× |
| Czechia | $108,238 | $31,828 | 3.40× |
| Spain | $108,238 | $35,327 | 3.06× |
| Italy | $108,238 | $40,430 | 2.68× |
| France | $108,238 | $46,103 | 2.35× |
| Finland | $108,238 | $53,156 | 2.04× |
| Germany | $108,238 | $56,104 | 1.93× |
| Belgium | $108,238 | $56,582 | 1.91× |
| Austria | $108,238 | $58,269 | 1.86× |
| Netherlands | $108,238 | $67,465 | 1.60× |
| Denmark | $108,238 | $71,026 | 1.52× |
| Iceland | $108,238 | $85,863 | 1.26× |
| Ireland | $108,238 | $112,895 | 0.96× |
19 jurisdictions at an identical €100,000 statutory ceiling, ranked by the years of GDP per capita it covers. Converted once from the euro at the World Bank 2024 average rate.
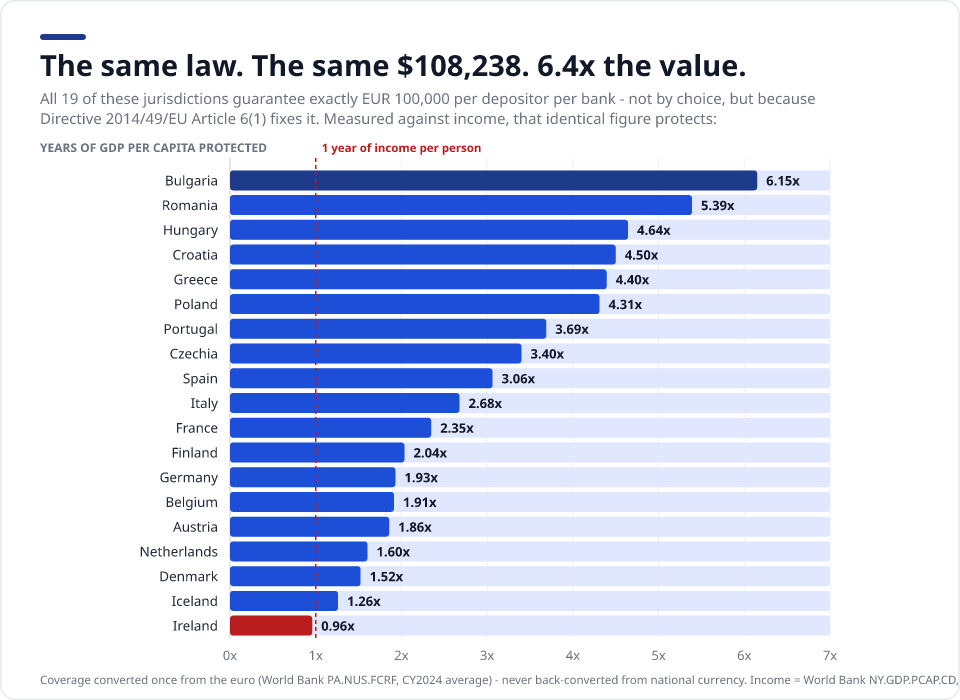
This is why a “deposit protection by country” table denominated only in euro or dollars misleads for a third of Europe: it reports a legal constant as though it were a finding. The variation is real, but it lives in the denominator.
The full index
68 jurisdictions, one currency, one method. Every row is a statutory ceiling per depositor per institution, for a single ownership category and ordinary balances, and every row links the primary instrument it comes from.
| # | Jurisdiction | Ceiling | Currency | Ceiling (USD) | Years protected | Rank by years | Note | Source |
|---|---|---|---|---|---|---|---|---|
| 1 | United States | 250,000 | USD | $250,000 | 2.90× | 26 | ownership-category multiplier | fdic.gov |
| 2 | Norway | 2,000,000 | NOK | $186,119 | 2.07× | 39 | Norway-booked deposits only | bankenessikringsfond.no |
| 3 | Australia | 250,000 | AUD | $164,978 | 2.55× | 31 | FX deposits excluded; not pre-funded | apra.gov.au |
| 4 | United Kingdom | 120,000 | GBP | $153,371 | 2.88× | 27 | raised 2025-12-01 | fscs.org.uk |
| 5 | Indonesia | 2,000,000,000 | IDR | $126,140 | 25.61× | 1 | 3T rate condition voids cover | lps.go.id |
| 6 | Switzerland | 100,000 | CHF | $113,579 | 1.05× | 60 | system capped CHF 7.9bn | esisuisse.ch |
| 7 | Liechtenstein | 100,000 | CHF | $113,579 | 0.52× | 66 | hard CHF figure, not a EUR equivalent | gesetze.li |
| 8 | Sweden | 1,150,000 | SEK | $108,823 | 1.90× | 46 | EUR100k equivalent, reset 5-yearly | riksgalden.se |
| 9 | Germany | 100,000 | EUR | $108,238 | 1.93× | 44 | 3 sector schemes | edb-banken.de |
| 10 | France | 100,000 | EUR | $108,238 | 2.35× | 36 | +EUR100k separate State passbook guarantee | garantiedesdepots.fr |
| 11 | Italy | 100,000 | EUR | $108,238 | 2.68× | 29 | per bank even within a group | fitd.it |
| 12 | Spain | 100,000 | EUR | $108,238 | 3.06× | 25 | fgd.es | |
| 13 | Netherlands | 100,000 | EUR | $108,238 | 1.60× | 51 | aggregates across brand names | dnb.nl |
| 14 | Ireland | 100,000 | EUR | $108,238 | 0.96× | 62 | credit unions in scope | depositguarantee.ie |
| 15 | Portugal | 100,000 | EUR | $108,238 | 3.69× | 20 | THB uncapped 12 months | fgd.pt |
| 16 | Greece | 100,000 | EUR | $108,238 | 4.40× | 11 | net set-off | teke.gr |
| 17 | Belgium | 100,000 | EUR | $108,238 | 1.91× | 45 | 3 parallel ceilings | garantiefonds.belgium.be |
| 18 | Austria | 100,000 | EUR | $108,238 | 1.86× | 48 | 3 sector schemes (corrected) | einlagensicherung.at |
| 19 | Finland | 100,000 | EUR | $108,238 | 2.04× | 41 | amalgamation = one bank | rvv.fi |
| 20 | Denmark | 100,000 | EUR | $108,238 | 1.52× | 53 | EUR-denominated, not DKK | fs.dk |
| 21 | Poland | 100,000 | EUR | $108,238 | 4.31× | 13 | paid in PLN at failure date | bfg.pl |
| 22 | Czechia | 100,000 | EUR | $108,238 | 3.40× | 22 | paid in CZK at decisive day | garancnisystem.cz |
| 23 | Hungary | 100,000 | EUR | $108,238 | 4.64× | 7 | paid in HUF | oba.hu |
| 24 | Romania medium | 100,000 | EUR | $108,238 | 5.39× | 5 | sourcing medium | eur-lex.europa.eu |
| 25 | Bulgaria | 100,000 | EUR | $108,238 | 6.15× | 4 | euro adopted 2026-01-01 | dif.bg |
| 26 | Croatia | 100,000 | EUR | $108,238 | 4.50× | 9 | net set-off | haod.hr |
| 27 | Iceland | 100,000 | EUR | $108,238 | 1.26× | 57 | EUR-denominated, ISK floats | althingi.is |
| 28 | San Marino | 100,000 | EUR | $108,238 | n/a | — | mirrors DGSD level but outside the EU | bcsm.sm |
| 29 | Hong Kong SAR | 800,000 | HKD | $102,514 | 1.89× | 47 | raised 2024-10-01 | dps.org.hk |
| 30 | Taiwan | 3,000,000 | TWD | $93,425 | 2.73× | 28 | FX + income from IMF fallback | cdic.gov.tw |
| 31 | Singapore | 100,000 | SGD | $74,837 | 0.79× | 65 | +S$100k separate CPF bucket | sdic.org.sg |
| 32 | South Korea | 100,000,000 | KRW | $73,347 | 2.02× | 42 | doubled 2025-09-01 | kdic.or.kr |
| 33 | Canada | 100,000 | CAD | $73,027 | 1.33× | 56 | 9 coverage categories | cdic.ca |
| 34 | Jordan | 50,000 | JOD | $70,423 | 13.88× | 2 | JOD only, FX excluded | dic.gov.jo |
| 35 | China | 500,000 | CNY | $69,469 | 5.23× | 6 | cap rarely binds in practice | pbc.gov.cn |
| 36 | Japan | 10,000,000 | JPY | $66,065 | 1.95× | 43 | settlement deposits UNLIMITED | fsa.go.jp |
| 37 | New Zealand | 100,000 | NZD | $60,521 | 1.22× | 58 | scheme live only since 2025-07-01 | rbnz.govt.nz |
| 38 | Azerbaijan | 100,000 | AZN | $58,824 | 8.06× | 3 | rate-conditioned eligibility | adif.gov.az |
| 39 | Argentina | 50,000,000 | ARS | $54,663 | 3.91× | 17 | doubled 2026-04-01; high-yield excluded | bcra.gob.ar |
| 40 | Malaysia | 250,000 | MYR | $54,628 | 4.60× | 8 | separate Islamic/conventional buckets | pidm.gov.my |
| 41 | Serbia | 50,000 | EUR | $54,119 | 3.96× | 16 | NOT EU - half the DGSD level | aod.rs |
| 42 | Montenegro | 50,000 | EUR | $54,119 | 4.08× | 15 | EUR 100,000 suspended until EU accession | fzdcg.org |
| 43 | Saudi Arabia | 200,000 | SAR | $53,333 | 1.50× | 55 | rulebook.sama.gov.sa | |
| 44 | Bahrain medium | 20,000 | BHD | $53,191 | 1.79× | 49 | covers URIA; date corrected to 2011-01-13 | cbb.gov.bh |
| 45 | Brazil | 250,000 | BRL | $46,391 | 4.50× | 10 | rolling R$1m / 4yr global cap | fgc.org.br |
| 46 | Bosnia and Herzegovina | 70,000 | BAM | $38,726 | 4.12× | 14 | BAM-denominated, not a euro limit | aod.ba |
| 47 | Turkey | 1,200,000 | TRY | $36,579 | 2.30× | 38 | re-indexed every January | tmsf.org.tr |
| 48 | Peru | 122,000 | PEN | $32,512 | 3.81× | 19 | RE-SET EVERY QUARTER | fsd.org.pe |
| 49 | North Macedonia | 30,000 | EUR | $32,471 | 3.49× | 21 | natural persons ONLY; paid in denars | fodsk.org.mk |
| 50 | Thailand | 1,000,000 | THB | $28,334 | 3.84× | 18 | THB-only, FX excluded | dpa.or.th |
| 51 | Albania | 2,500,000 | ALL | $26,846 | 2.36× | 35 | SCA sub-tier ALL 2,000,000 | asd.gov.al |
| 52 | Kazakhstan | 10,000,000 | KZT | $21,324 | 1.51× | 54 | ordinary tier; term-locked savings 20m | kdif.kz |
| 53 | Georgia | 50,000 | GEL | $18,378 | 2.05× | 40 | raised 2026-04-01 from GEL 30,000 | diagency.ge |
| 54 | Philippines | 1,000,000 | PHP | $17,455 | 4.38× | 12 | doubled 2025-03-15 by Board issuance | pia.gov.ph |
| 55 | Russia | 1,400,000 | RUB | $15,127 | 1.01× | 61 | 3 simultaneous ceilings | consultant.ru |
| 56 | Vietnam | 350,000,000 | VND | $14,484 | 3.07× | 24 | changed 2026-07-13; VND+individuals only | div.gov.vn |
| 57 | Colombia | 50,000,000 | COP | $12,272 | 1.54× | 52 | frozen since 2017 | fogafin.gov.co |
| 58 | India | 500,000 | INR | $5,976 | 2.31× | 37 | per right and capacity | dicgc.org.in |
| 59 | South Africa | 100,000 | ZAR | $5,456 | 0.87× | 63 | scheme live only since 2024-04-01 | resbank.co.za |
| 60 | Nepal medium | 500,000 | NPR | $3,739 | 2.56× | 30 | natural persons ONLY | dcgf.gov.np |
| 61 | Kenya | 500,000 | KES | $3,709 | 1.74× | 50 | draft notice would double it | kdic.go.ke |
| 62 | Sri Lanka | 1,100,000 | LKR | $3,641 | 0.80× | 64 | FX from CBSL fallback | cbsl.gov.lk |
| 63 | Pakistan | 1,000,000 | PKR | $3,590 | 2.43× | 33 | doubled 2024-10-01 | dpc.org.pk |
| 64 | Nigeria | 5,000,000 | NGN | $3,381 | 3.12× | 23 | DMB tier; MFB 2m | ndic.gov.ng |
| 65 | Zimbabwe medium | 3,000 | USD | $3,000 | 1.20× | 59 | DTMFI tier USD 2,000; no gazetted date - verify with DPC | dpcorp.co.zw |
| 66 | Tanzania | 7,500,000 | TZS | $2,887 | 2.42× | 34 | bot.go.tz | |
| 67 | Uganda | 10,000,000 | UGX | $2,662 | 2.47× | 32 | joint account gets its own limit | dpf.or.ug |
| 68 | Ghana | 6,250 | GHS | $441 | 0.18× | 67 | SDIs only GHS 1,250 | gdpc.gov.gh |
Ranked by statutory ceiling in US dollars. Rows shaded blue are fixed at €100,000 by EU Directive 2014/49/EU rather than set nationally. Rows marked “medium” or “low” rest on a single source or an unresolved detail and are flagged rather than quietly shipped. Where the World Bank spine had no exchange rate, the row names the fallback source it used instead.
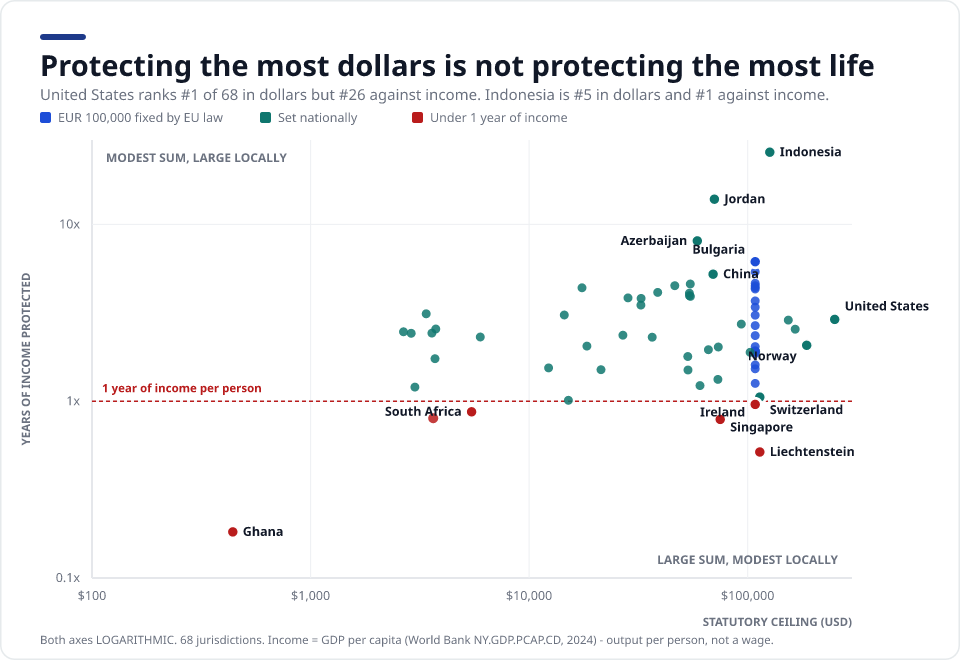
Protecting the most dollars is not protecting the most life
Rank the same 68 jurisdictions by dollars and then by years of income, and the two orders disagree sharply. The disagreement is the point: a guarantee is only meaningful relative to what a life costs where you live.
At $250,000, United States has the largest guarantee in this index in cash terms and ranks #26 of 67 once set against income per person. The clearest reversal runs the other way: Philippines ranks only #54 in dollars but #12 against income, at 4.38×. At the other end, 6 jurisdictions protect less than a single year of average income: Ghana, Liechtenstein, Singapore, Sri Lanka, South Africa, Ireland. Liechtenstein is the counter-intuitive one: a CHF 100,000 ceiling is generous in absolute terms, but it has the highest GDP per capita in the index, so it buys barely half a year.
Does this table hold up?
The dataset was rebuilt independently from primary sources — each jurisdiction from its own deposit insurer or statute — and then checked against the benchmark the field already publishes. IADI reports coverage as a multiple of GDP per capita across 53 jurisdictions circa 2020.
| Metric | This index (68 jurisdictions, 2024) | IADI published (53 jurisdictions, 2020) |
|---|---|---|
| Median coverage / GDP per capita | 2.42× | 2.30× |
| Mean | 3.20× | 3.6× |
| Range | 0.18×–25.61× | 0.4×–over 20x |
Our median lands +5.2% from IADI’s, built from different sources on a different vintage. That is the check that matters: this table is not asking to be trusted, it reproduces the accepted benchmark and then extends it by 14 jurisdictions and 4 years.
What this table is not
Ten ways a cross-country coverage comparison goes wrong. Each one applies to rows above, and each is a reason to read the ceiling as a starting point rather than an answer.
Ownership categories mean the headline is not the maximum
This table compares statutory single-category ceilings. Several schemes multiply: the US has seven ownership categories, so a trust owner with five or more beneficiaries can reach $1,250,000 at one bank. Canada has nine, Malaysia runs separate Islamic and conventional buckets, and Nigeria and India cover per “right and capacity”.
Six ceilings are set in euro but paid in another currency
All nineteen EU and EEA rows carry the same €100,000, but in Denmark, Poland, Czechia, Hungary, Romania and Iceland the euro is not the national currency: the ceiling is denominated in euro and paid locally at the failure-date rate. Back-converting a published zloty or koruna figure at this year’s rate would inject variance that does not exist in the statute, so every euro-fixed row here converts once, from the euro. Sweden is the near-miss — it sets its own krona ceiling designed to track €100,000, which is why it sits just outside the identical block rather than inside it.
Four jurisdictions use an indexed unit of account, not a currency
Mexico (UDI), Chile (UF), Bolivia (UFV) and Uruguay (UI) denominate coverage in units that are repriced continuously, so they have no fixed currency value and are shown in a separate panel rather than ranked. Chile compounds it: the cap is per calendar year rather than per failure, and covers natural persons only.
Sub-limits by institution class
A single national headline can hide a lower tier. Nigeria protects ₦5m at banks but ₦2m at microfinance institutions; Ghana GHS 6,250 but GHS 1,250 at specialised deposit-takers; Albania ALL 2.5m at banks but ALL 2m at savings-credit associations; Zimbabwe US$3,000 at banks but US$2,000 at microfinance. Quoting only the top tier overstates what an ordinary account holder is protected for.
Foreign-currency deposits split the world in two
Excluded outright in Japan, Singapore, Thailand, Vietnam, Jordan and Australia. Covered but paid in local currency at the failure-date rate in Pakistan, Uganda, South Africa, Ghana, Ukraine, Czechia, Romania and Hungary — so the depositor carries the conversion risk. Ring-fenced separately in Uruguay.
Coverage can be void on behaviour or interest rate
Indonesia’s “3T” rules remove cover entirely if the deposit rate exceeds the LPS guarantee rate. Azerbaijan caps eligibility at 12% on manat and 2.5% on foreign currency. Argentina excludes deposits paying above the central bank reference. Most schemes have no analogue, so a chased yield can silently cost the guarantee.
Net set-off against what you owe the bank
Greece pays €77,000 on an €80,000 deposit held against a €3,000 debt to the same bank. Croatia, Nigeria, Ghana, Albania, Bosnia, Montenegro and North Macedonia apply the same netting. It is invisible in any headline table, including this one.
“One country, one scheme” is false
Germany has three or more statutory schemes, Austria three, Italy two, and Korea spans KDIC plus separate federation funds. The figure is the same across them; the body that pays it is not.
Temporary high balances are not harmonised
Portugal protects house-sale proceeds without cap for 12 months; Germany, Austria and the Netherlands add €500,000 on top of the base, so roughly €600,000 in total — routinely misreported as €500,000. Montenegro adds €30,000. Directive (EU) 2026/804 harmonises this at €500,000 for six months, but transposition runs to 11 May 2028, so this table reports current law.
Statute and practice can disagree
The Philippines statute (RA 3591) still reads ₱500,000; the operative ₱1,000,000 comes from a Board issuance under delegated authority. Montenegro’s Article 7(4) reads €100,000, but a transitional article suspends it at €50,000 until EU accession. Reading only the headline article publishes the wrong number in both cases.
The headline is a floor, not a ceiling, for a real household. Everything here is the statutory single-category ceiling: per depositor, per institution, ordinary balances. What any given person can actually recover depends on how their accounts are titled, what currency they are in, and what they owe the same bank.
Not ranked, and why
Verified jurisdictions that cannot honestly enter a dollar ranking, and the ones left out altogether.
Indexed units of account — no fixed currency value
Four schemes denominate coverage in a unit that is repriced continuously, so any dollar figure would report the quote date rather than a policy. Values below are pinned to 2024-12-31 to match the conversion spine.
| Jurisdiction | Unit | Statutory coverage | Unit value | Local-currency equivalent |
|---|---|---|---|---|
| Mexico | UDI | 400,000 UDI | 8.34091 MXN | 3,336,364 MXN |
| Chile | UF | UF 200 per bank, UF 400 system-wide, per calendar year | 38,416.69 CLP | 7,683,338 CLP |
| Bolivia | UFV | 40,000 UFV | 2.57833 BOB | 103,133 BOB |
| Uruguay | UI | UI 250,000 plus a separate USD 10,000 for foreign currency | 6.169 UYU | 1,542,250 UYU |
These drift fast, which is exactly why they are not ranked: Bolivia’s UFV has risen about 28% and Mexico’s UDI about 5% since the pinned date. Chile compounds it further — its cap is per calendar year rather than per failure, and covers natural persons only, where Uruguay explicitly covers legal persons too.
Blanket guarantees — no ceiling to rank
- Kuwait. Permanent blanket sovereign guarantee, Law 30/2008. There is no ceiling to rank.
- Ukraine. Full cover for the duration of martial law, reverting to UAH 600,000 exactly three months after it ends.
No scheme at all
- Qatar. The central bank is mandated to establish a deposit insurance scheme and has not done so.
Excluded rather than shipped shaky
Six jurisdictions were researched and then deliberately left out. Publishing a plausible-looking wrong number would be worse than an honest gap.
- Morocco. The cited circular 22/G/2006 was expressly repealed by circular 6/W/2018. No in-force instrument states the circulating MAD 80,000 figure.
- Egypt. Law 194/2020 Art. 176 delegates the maximum to articles of association that were never published, so no ceiling exists in the public record.
- Bangladesh. Live conflict: the central bank publishes BDT 100,000 under a repealed act, while the only source for the 2026 act states no ceiling at all.
- Ecuador. Not a single national limit but USD 1,000 to 32,000 by institutional segment, and the primary source is a 2016 document.
- Lebanon. The cited instrument does not contain the claim, and LBP 75m is economically meaningless under capital controls.
- United Arab Emirates. Both available citations are repealed instruments and the current text is unreadable, so even the "no scheme" conclusion cannot be sourced.
Method
Currency
Statutory ceilings converted at the World Bank official exchange rate, LCU per US$, period average, for calendar year 2024. For EU and EEA members the ceiling is €100,000 by law and is converted once, from the euro — national-currency figures are never back-converted, because those schemes convert at the failure date rather than at a fixed rate. Where the spine has no rate, the row names its fallback: Sri Lanka from the Central Bank of Sri Lanka, and Taiwan from the IMF, since Taiwan is absent from World Bank data entirely.
Income
Coverage as a multiple of GDP per capita — the metric IADI, the FSB and the IMF use for exactly this comparison. GDP per capita is output per person, including capital and government. It is not a wage, and it is not a median. A median-salary denominator would be the better yardstick, but ILOSTAT publishes a mean rather than a median and does not cover enough of these jurisdictions to use without silently dropping the low-coverage end of the table.
Scope
Statutory ceilings per depositor per institution, single ownership category, ordinary (non-temporary) balances. Of 74 jurisdictions researched, 68 are published here and six were excluded on source quality. One jurisdiction ranks in dollars but shows no income figure, because the spine publishes none for it; it is excluded from every income statistic rather than given a substituted value.
Freshness
Deposit ceilings move more than people assume: 22% of the rows here changed within 24 months. Peru re-sets quarterly, Turkey re-indexes every January, and the UK, Sweden, South Korea, Argentina and Georgia all moved recently. This index is reviewed quarterly and every row carries the date its figure was confirmed. Where no effective date is verifiable, the row shows none rather than a guess.
Frequently asked questions
Is my money safe if my bank fails?
Up to the ceiling for your jurisdiction, and only for eligible deposits. Above it you become an ordinary creditor of the failed bank and may recover little or nothing. The practical implication of this table is that the ceiling is per depositor per institution, so balances above it can often be protected simply by splitting them across separate banks.
Why do so many countries have exactly €100,000?
Because it is not a coincidence or a convergence. EU Directive 2014/49/EU Article 6(1) requires every member state to set the level at €100,000, so 19 jurisdictions in this index carry the identical figure by law. What differs between them is what that figure is worth locally, which is the whole point of the second column.
Does this table tell me the most I can be covered for at one bank?
No — it is deliberately the opposite. Every figure is the statutory ceiling for a single ownership category. Schemes that recognise multiple categories can cover one depositor for far more at the same institution: in the US, seven categories mean a trust owner with several beneficiaries can be insured well past a million dollars at one bank.
Why use GDP per capita rather than average salary?
Because a salary series deep enough to cover these jurisdictions does not exist. ILOSTAT publishes a mean rather than a median, and its country coverage would force us to drop exactly the low-coverage jurisdictions the comparison depends on. GDP per capita is the metric IADI and the IMF use for this comparison, but it is output per person rather than a wage, and it should be read as a yardstick rather than as anyone’s income.
How current is this?
The ceilings were confirmed in 2026-07 and the index is reviewed quarterly. The conversion rates and income figures are calendar 2024, the latest complete year the World Bank publishes — so the ceilings are current even though the spine carries an earlier date. Given that 22% of these limits changed within 24 months, always confirm your own jurisdiction with its deposit insurer before acting.
Sources
- World Bank — Official exchange rate (LCU per US$, period average), PA.NUS.FCRF, CY2024
- World Bank — GDP per capita (current US$), NY.GDP.PCAP.CD, CY2024
- Directive 2014/49/EU on deposit guarantee schemes — Article 6(1) fixes the coverage level at EUR 100,000
- Directive (EU) 2026/804 (DGSD II) — in force 10 May 2026, transposition due 11 May 2028
- FDIC — deposit insurance coverage: US$250,000 per depositor, per insured bank, per ownership category
- IADI — research paper on deposit insurance coverage and scope (the published coverage/GDP-per-capita benchmark this index is validated against)
Each of the 68 rows above additionally links the primary instrument it comes from — the scheme’s own publication or the governing statute. No calculator site is cited anywhere in this study.
Cite this study
YouCalc (2024). Deposit Insurance Coverage Index: what your bank guarantee is worth. https://youcalc.com/en/studies/deposit-insurance-coverage-index/
Free to reuse under CC BY 4.0 — please credit YouCalc with a link.
Related calculators
Emergency Fund Calculator
Size your emergency fund (3–6 months of expenses), see how funded you are, and track how long it takes to reach your target. Multi-currency, free.
Net Worth Calculator
Add up your assets and subtract your debts to find your net worth, in any currency. Cash, investments and property versus mortgage, loans and credit cards.
Compound Interest Calculator
See how savings grow with compound interest and regular contributions. Pick your rate, frequency and term, then watch contributions vs. interest stack up.
Retirement Savings Calculator
Retirement savings calculator: project your nest egg from age, balance, contributions, employer match and expected return. Free, no signup.
FIRE Number Calculator
FIRE number calculator using the 4% rule (25× annual spending). Track progress and estimate years to financial independence. Multi-currency, free.
Budget Planner
Split your monthly take-home pay into Needs, Wants and Savings with the 50/30/20 budget rule. Edit the percentages, see each amount, in any currency.